> ## Documentation Index
> Fetch the complete documentation index at: https://help.kajabi.com/llms.txt
> Use this file to discover all available pages before exploring further.
# Report: Upsell Purchases Over Time
*Monitor upsell performance over time to identify trends and measure revenue impact.*
This feature is being rolled out gradually. Some things are still being refined, and more detailed how-to articles are on the way. If you run into anything unexpected, reach out to [**payments.support@kajabi.com**](mailto:payments.support@kajabi.com) and the team will assist.
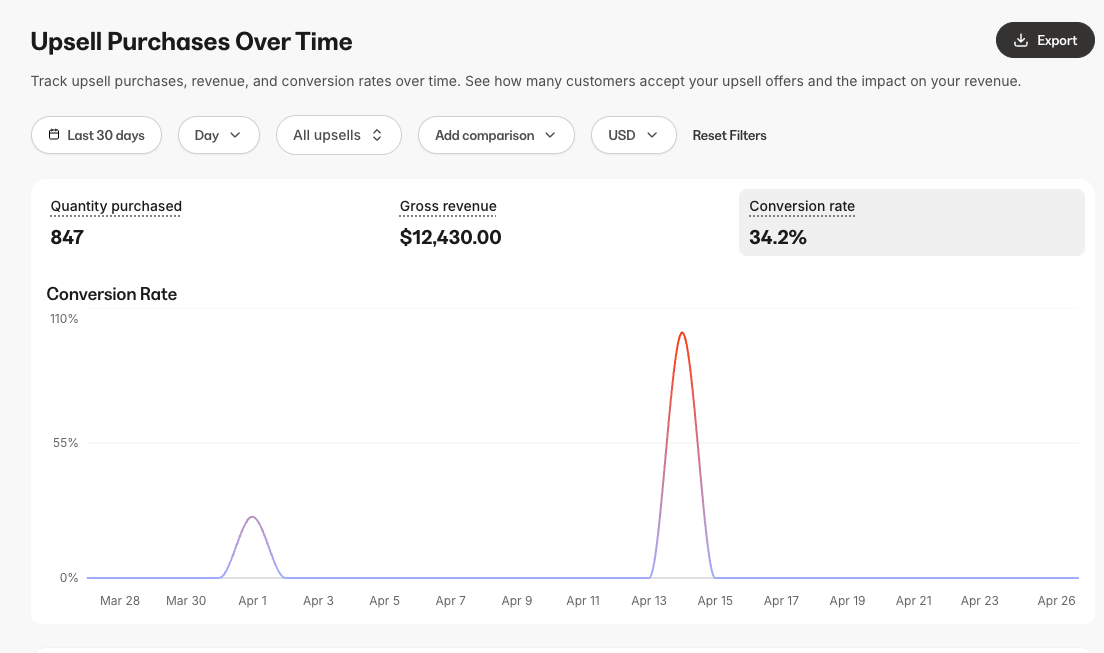
The Upsell Purchases Over Time report shows how your upsells are performing across all offers and upsell flows. Use it to identify trends, measure revenue impact, and make informed decisions about which upsells to optimize.
Data in this report begins at the launch of Enhanced Upsells in Spring 2026. Upsell activity prior to that date is not included.
This report is most useful for
* Tracking upsell purchase activity over time across all offers.
* Measuring gross revenue generated from upsells.
* Monitoring conversion rate trends to identify which time periods or changes had the most impact.
## Access the Upsell Purchases Over Time report
1. Go to **Analytics** > **Reports**.
2. Search for or select **Upsell Purchases Over Time**.
 ## Data presented in this report
### Visual chart
**Upsell Purchases Over Time (line chart)**
Displays upsell data over time. Use the chart toggle to switch between the following metrics:
* **Quantity purchased** — total count of accepted upsell purchases within the selected time range. If a single order contains multiple accepted upsells, each counts individually.
* **Conversion rate** — percentage of customers who viewed an upsell and completed the purchase. Calculated as: (number of completed upsell purchases / number of upsells presented) x 100.
* **Gross revenue** — total revenue generated from accepted upsell purchases within the selected time range.
When a comparison period is enabled, the chart overlays the comparison data for the selected metric.
### Data table
The table displays the following columns, broken down by date based on the selected granularity:
| **Column** | **Description** |
| :-------------- | :---------------------------------------------------------------------------------------- |
| Date | The time period, based on the selected granularity (Day, Week, Month, Year) |
| Presented | Number of times an upsell was presented to a customer, aggregated across all upsell flows |
| Conversion rate | The percentage of upsells presented that resulted in a completed purchase |
| Gross revenue | Total revenue from accepted upsell purchases in that period |
| Quantity | Total count of accepted upsell purchases in that period |
Click any column header to sort the table in ascending or descending order.
## Filters
Use the filter bar to customize the data displayed in the report and table. Changing any filter updates both the chart and the table.
* **Timeframe** — defaults to last 30 days. Select a preset range or choose a custom date range.
* **Granularity** — defaults to Day. Choose how data is grouped: Day, Week, Month, or Year.
* **Upsells** — defaults to All upsells. Filter to a specific upsell to see its individual performance.
* **Comparison** — disabled by default. Choose to compare against a past period. When enabled, the chart overlays the comparison period.
* **Currency** — view stats in your preferred currency.
## Export
Exporting the report generates a file that matches the columns currently displayed in the table and reflects any filters you have applied.
Export columns include:
* Date
* Presented
* Conversion rate
* Gross revenue
* Quantity
## Data presented in this report
### Visual chart
**Upsell Purchases Over Time (line chart)**
Displays upsell data over time. Use the chart toggle to switch between the following metrics:
* **Quantity purchased** — total count of accepted upsell purchases within the selected time range. If a single order contains multiple accepted upsells, each counts individually.
* **Conversion rate** — percentage of customers who viewed an upsell and completed the purchase. Calculated as: (number of completed upsell purchases / number of upsells presented) x 100.
* **Gross revenue** — total revenue generated from accepted upsell purchases within the selected time range.
When a comparison period is enabled, the chart overlays the comparison data for the selected metric.
### Data table
The table displays the following columns, broken down by date based on the selected granularity:
| **Column** | **Description** |
| :-------------- | :---------------------------------------------------------------------------------------- |
| Date | The time period, based on the selected granularity (Day, Week, Month, Year) |
| Presented | Number of times an upsell was presented to a customer, aggregated across all upsell flows |
| Conversion rate | The percentage of upsells presented that resulted in a completed purchase |
| Gross revenue | Total revenue from accepted upsell purchases in that period |
| Quantity | Total count of accepted upsell purchases in that period |
Click any column header to sort the table in ascending or descending order.
## Filters
Use the filter bar to customize the data displayed in the report and table. Changing any filter updates both the chart and the table.
* **Timeframe** — defaults to last 30 days. Select a preset range or choose a custom date range.
* **Granularity** — defaults to Day. Choose how data is grouped: Day, Week, Month, or Year.
* **Upsells** — defaults to All upsells. Filter to a specific upsell to see its individual performance.
* **Comparison** — disabled by default. Choose to compare against a past period. When enabled, the chart overlays the comparison period.
* **Currency** — view stats in your preferred currency.
## Export
Exporting the report generates a file that matches the columns currently displayed in the table and reflects any filters you have applied.
Export columns include:
* Date
* Presented
* Conversion rate
* Gross revenue
* Quantity